Project Jouxter Tracker

Welcome to Project Jouxter Tracker

This application provides a comprehensive overview of your project's progress, budget, and ROI across different scenarios. Navigate through the sections to monitor key metrics and make informed decisions.

Project Overview

Overall Progress
53.06%
Budget
53% Consumed 47% Remaining
Man-Days
66% Consumed 34% Remaining
ROI Comparison

Task Progress

Completed In Progress Delayed

Scenarios

Each scenario represents a different projection of the project's duration and costs. Select a scenario to view its details.

Scenario 1 - Project Finish in 36 Weeks

Gantt Chart Scenario 1

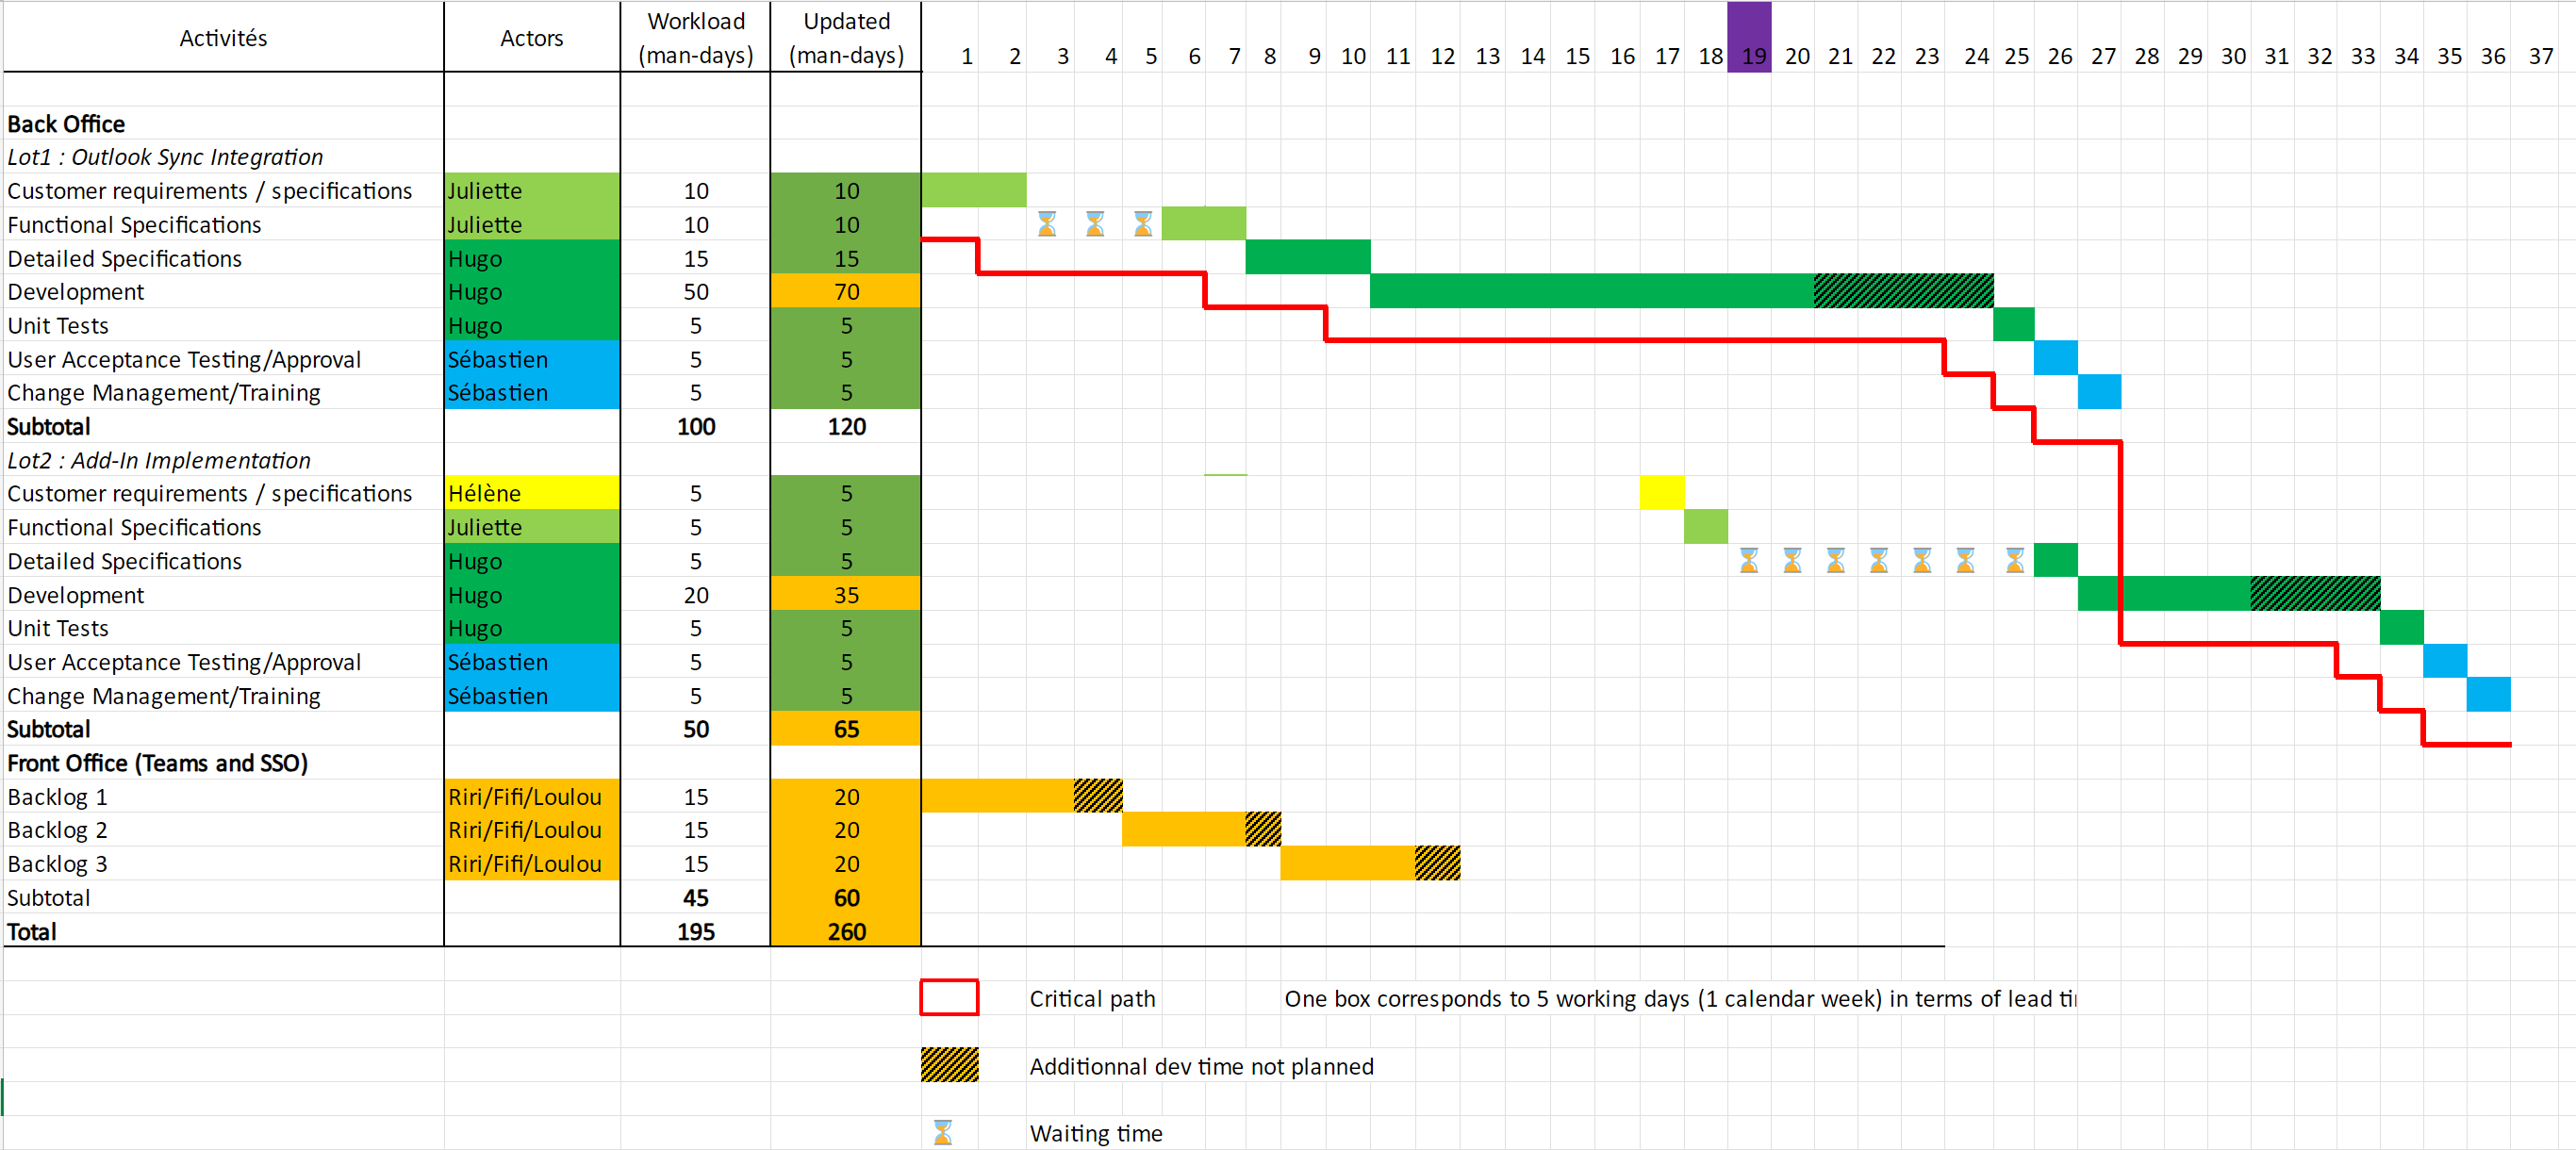
Total Additional Cost: €21,000.00

Additional Cost for You (20 Days Due to Scope Changes): €8,400.00

Description:

This scenario outlines the project completion within 36 weeks. The Gantt chart highlights:

  • Key Milestones: Clear timelines for back-office and front-office tasks.
  • Critical Path: Highlighted in red, showing dependencies that could impact the project timeline.
  • Additional Delays: Illustrated with striped yellow sections to indicate extra time due to scope changes.
  • Waiting Times: Represented by small hourglass icons, pinpointing pauses in progress.

Comment: "Scenario 1 provides a realistic completion timeline but includes delays in the critical path due to scope changes, adding 20 extra days."

Scenario 2 - Project Finish in 29 Weeks

Gantt Chart Scenario 2

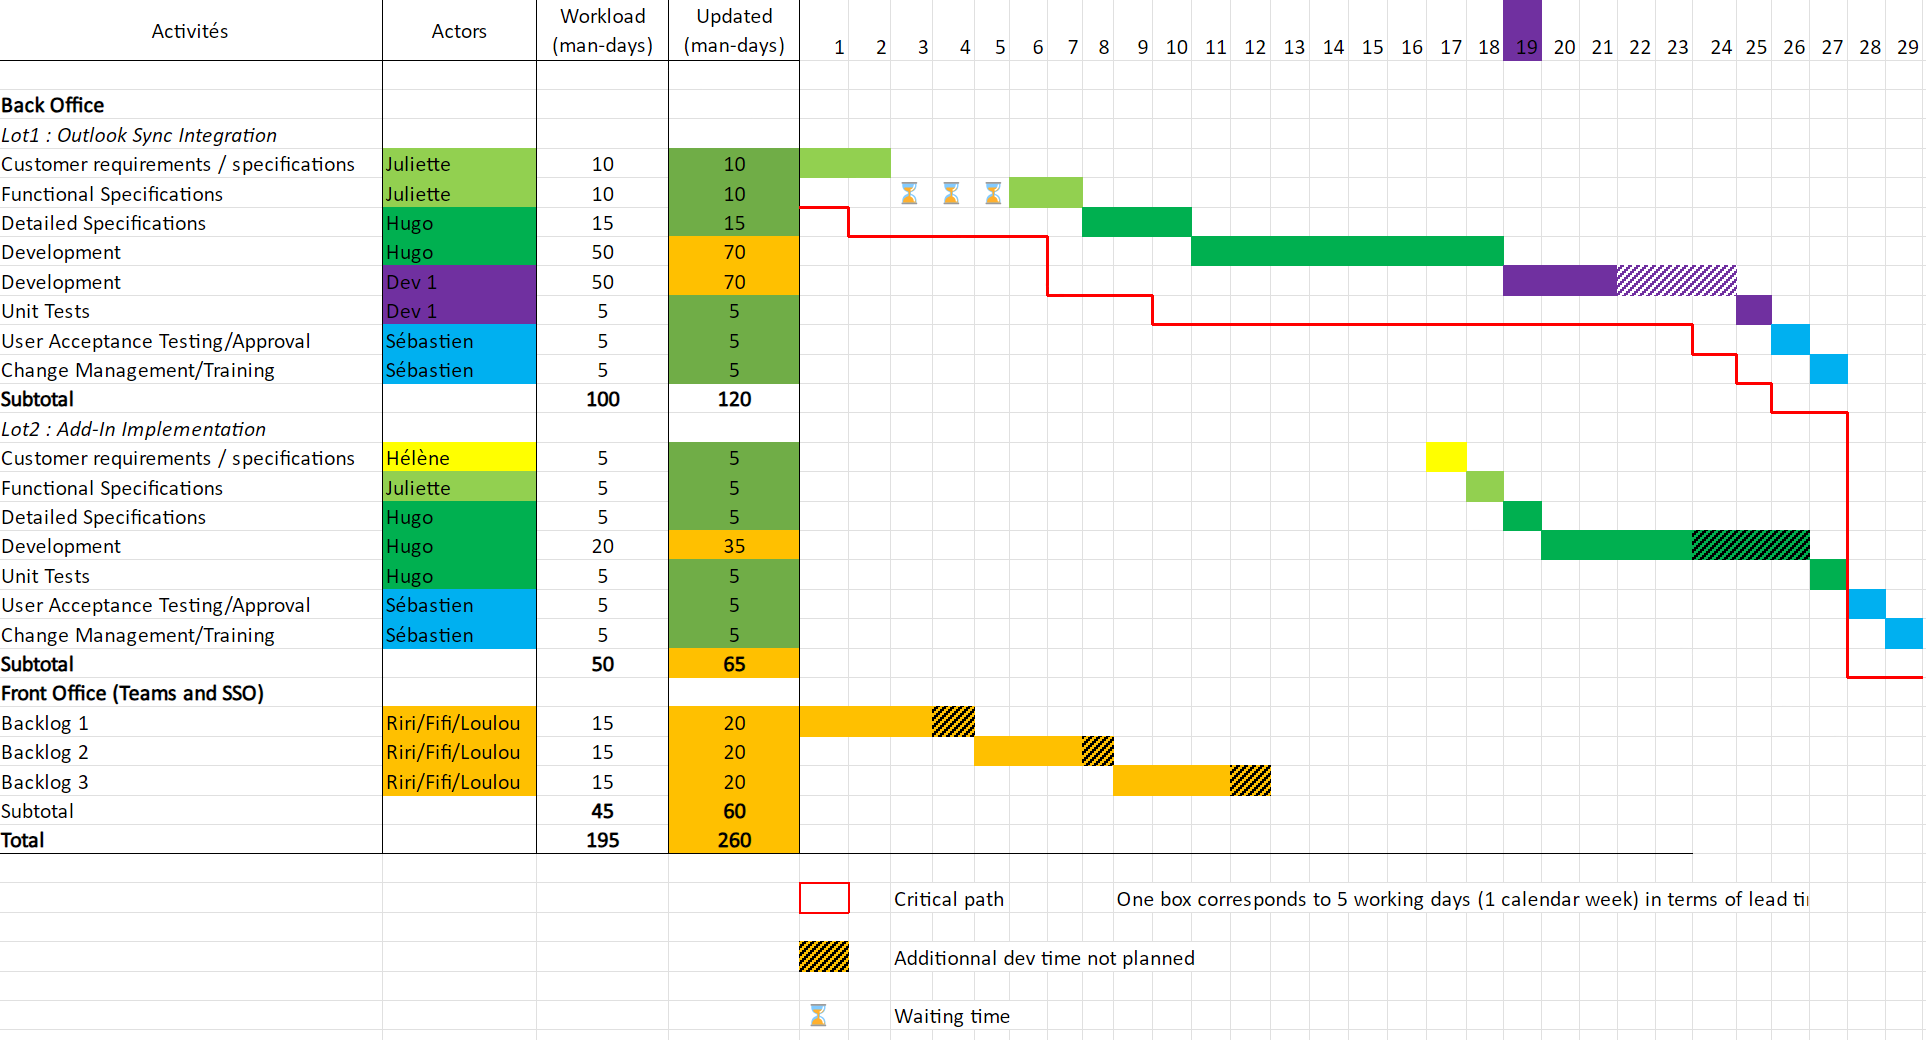
Total Additional Cost: €35,700.00

Additional Cost for You (+1 Developer for 7 Weeks): €23,100.00

Description:

This scenario accelerates the project to complete in 29 weeks. Key features include:

  • Increased Resources: One additional developer is added, reflected in the updated workload for back-office tasks.
  • Reduced Delays: The striped sections are minimized compared to Scenario 1, indicating better resource allocation.
  • Critical Path Stability: Despite a tighter schedule, the critical path remains well-managed.

Comment: "This scenario optimizes resource allocation to reduce delays, but at an increased cost of €35,700, including €23,100 for additional developer time."

Scenario 3 - Project Finish in 26 Weeks

Gantt Chart Scenario 3

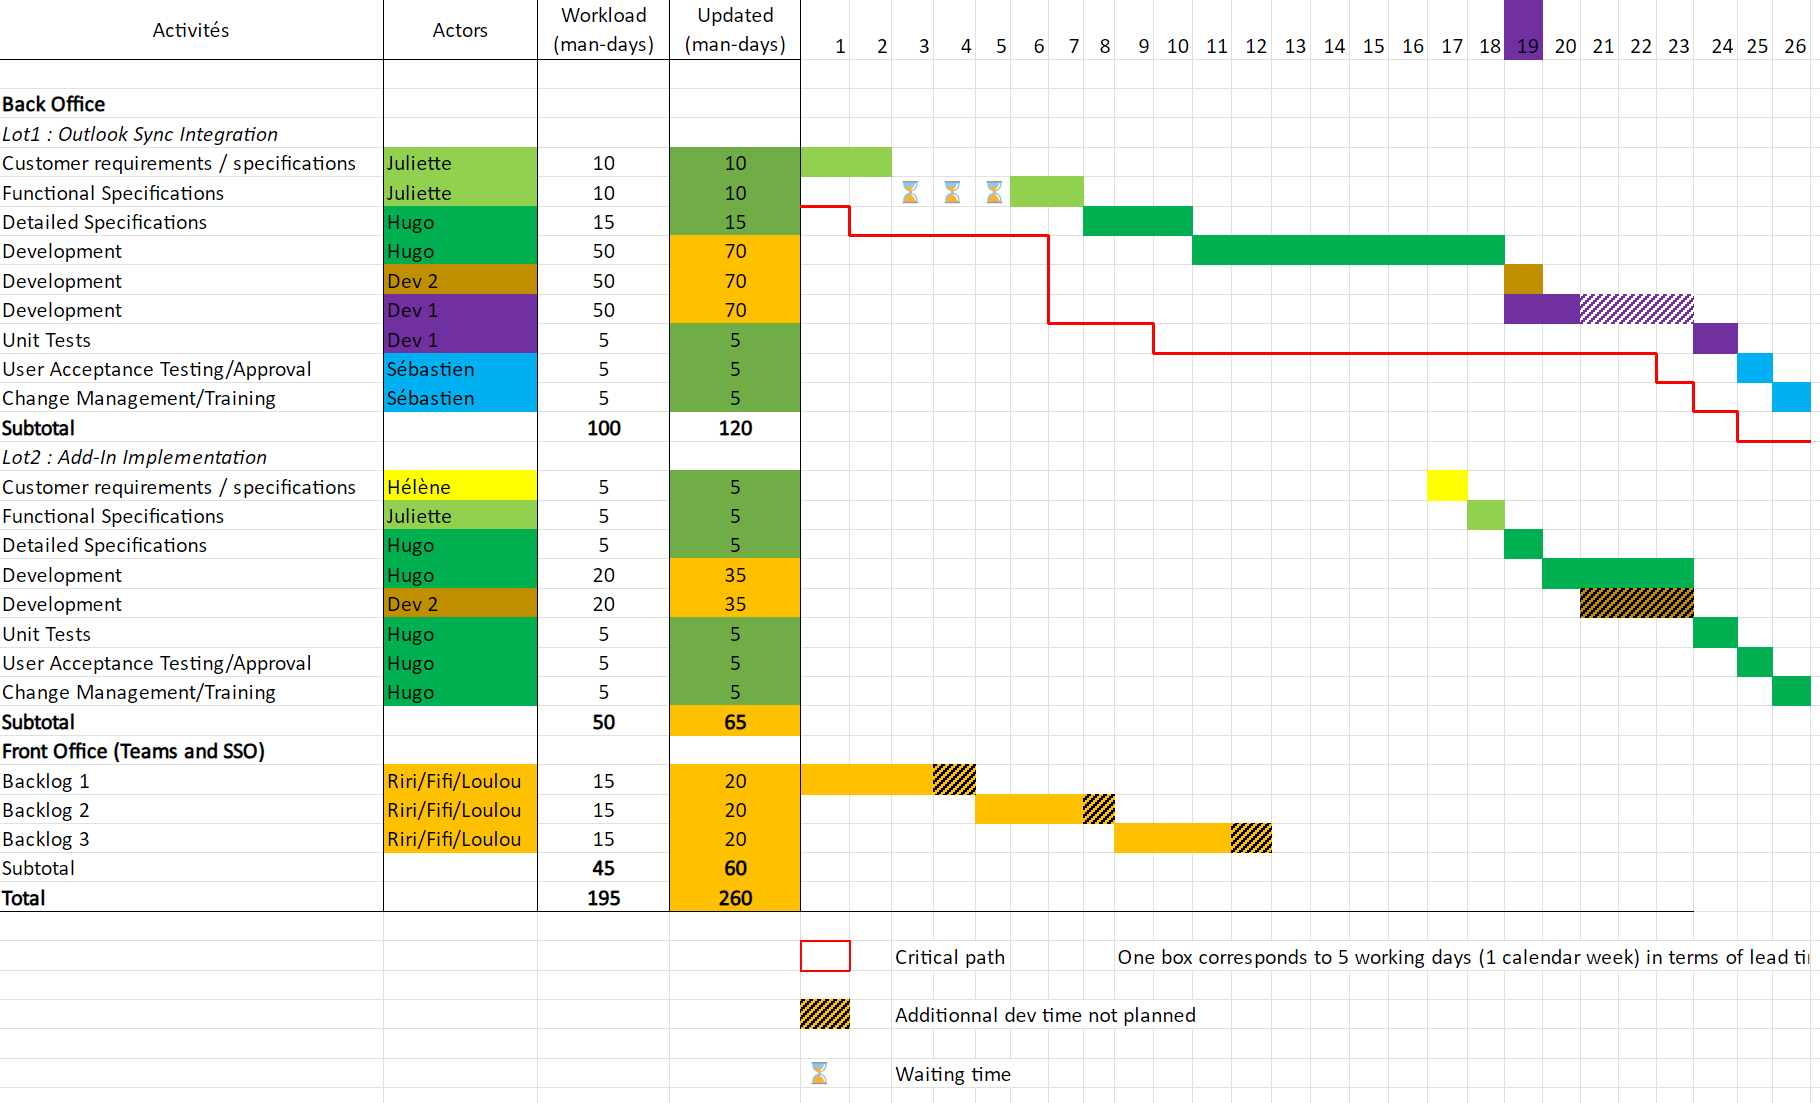
Total Additional Cost: €42,000.00

Additional Cost for You (+2 Developers for a Total of 10 Weeks): €29,400.00

Description:

The most ambitious scenario aims for project completion in just 26 weeks. Highlights include:

  • Aggressive Timeline: Requires two additional developers, reflected in the workload.
  • Minimal Delays: Striped sections are nearly eliminated, showing an intense focus on efficiency.
  • Risk Management: Critical paths are carefully monitored to avoid bottlenecks.

Comment: "Scenario 3 achieves the fastest timeline but at the highest cost of €42,000, including €29,400 for two additional developers."

Completed In Progress Delayed

General Observations for All Gantts

  • Visual Consistency: Ensure color coding (green for completed, yellow for in-progress, red for delays) is consistent across all scenarios for clarity.
  • Interactive Features: If possible, make the Gantt chart interactive to allow users to click on tasks for detailed descriptions.
  • Future Integration: Add tooltips for icons (e.g., hourglasses) to provide explanations of delays or pauses.